EE3901/EE5901 Sensor Technologies Week 2 Tutorial
Question 1
Let
Hint: write expressions for the Jacobian and covariance matrix and
then use
Answer
Since
Therefore
Question 2
You measure the current flowing through a circuit element and obtain
What is the voltage across the circuit element (
Hint: use Eq. (1), above.
Answer
Question 3
A thermistor (a temperature sensor) has a transfer function
where
(a) Suppose that there is a measurement uncertainty in
(b) Now suppose that the uncertainty is instead found in the parameter
(c) Now suppose that both
(d) If you change to a different thermistor with increased sensitivity
(i.e. larger value of
Answer
(a)
(b)
(c)
(d) Yes, a more sensitive thermistor will result in less variance in temperature. Intuitively, the more the resistance changes, the easier it is to characterise the underlying temperature because the spread of resistances corresponds to a smaller spread of temperatures. (If you cannot see this, draw the transfer function with two different slopes and imagine the impact of a given amount of resistance error.)
Question 4
A robot uses a wheel encoder to measure its velocity. There is software running on the robot that numerically differentiates velocity to obtain acceleration. The errors in velocity and acceleration are correlated because they derive from the same physical sensor.
The power consumption of the robot is estimated using the formula
where the first term represents drag and the second term represents the force required to change the acceleration.
When the robot is maintaining a constant velocity, the standard deviation of the velocity measurement is found to be
At a given instant, the measurements are
Answer
Question 5
A wearable inertial measurement unit is being used to monitor curvature
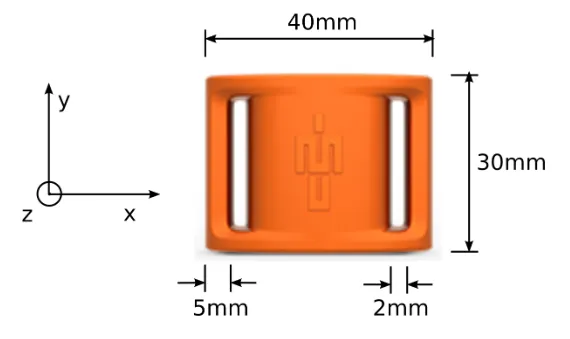
of the spine during rowing. The sensor (Figure Q5) has a flat edge
that is taped to the participant at specific vertebra of the spine.
The parameter of interest is flexion and extension of the spine, meaning
how far the person has bent forward or backward. This is characterised
by the angle of the sensor with respect to the vertical, i.e. the
angle between the sensor

The sensor being considered in this question. Image from Vicon IMeasureU BlueThunder data sheet.
Zoom:The angle can be calculated using the formula
where
Calculate the standard deviation in
Hint: the derivative of arctan (when the angle is expressed in radians) is
Answer
Given
Hence the Jacobian is
The covariance matrix is
Hence the standard deviation of
Question 6
A linear actuator drives a terminal device (e.g. gripper, hand, etc) of a robotic manipulator. The force exerted by the gripper is related to the displacement of the linear actuator by a function
The relationship between the linear actuator and terminal device.
Zoom:The terminal device is known to be perfectly accurate, but there is some error in the linear actuator. The error is expressed as a percentage by normalising to the standard deviation, e.g.
and
(a) Show that the relative error in the force is given by:
(b) Find a suitable transfer function
Hint: If the force error is constant then it must have no dependence upon f or x. Write an equation, separate the variables to obtain
Answer
(a) Outline of proof: use the result
and use the definitions of
(b)
where a is an arbitrary constant.
Question 7
You are calibrating a low-cost temperature sensor using the one point calibration method. With the sensor on the laboratory bench, you measure the temperature five times and obtain the following results: 26.86 °C, 26.91 °C, 28.04 °C, 27.99 °C, 27.99 °C.
You also have a reference thermometer, which you believe is substantially more accurate than the cheap sensor you are calibrating. It gives you the following measurements: 24.91 °C, 25.21 °C, 25.05 °C, 24.99 °C, 25.05 °C.
(a) Calculate the expected value of the measurements according to the sensor and the reference thermometer.
(b) Calculate the standard deviation of the measurements according to the sensor and the reference thermometer.
(c) Calculate the bias in the cheap sensor, assuming that the better thermometer is a reliable reference.
(d) Calibrate the cheap sensor, i.e. obtain an expression that can be used to correct for the bias.
(e) Suppose that you decide to combine information from both sensors by averaging their measurements. In other words, you will take both sensors into an environment to measure, you will obtain two measurements, and then average the result. Repeating 5 times as in the example here, you obtain a total of 10 measurements. What is the standard deviation obtained using this method?
(f) You notice from part (e) that the standard deviation of the average is worse than the standard deviation of just using the better sensor, i.e. there was no benefit obtained from the cheap sensor at all. Intuitively, there must be one way to extract information even from low quality sensors, so you are motivated to try a weighted average method of the form
where
Note: this principle (of giving more weight to those measurements which have lower variance) is a key concept behind the Kalman filter, which you will study in Weeks 3 - 4.
Answer
(a)
(b)
Note that you must use the sample estimator, i.e.
with the
(c)
(d)
(e) Assuming uncorrelated errors,
(f)
The standard deviation of the combined measurement is
i.e. smaller than the result in part (b). This shows that there was a benefit in combining the information from both sensors.