EE3901/EE5901 Sensor Technologies Practical 4 — Eddy current sensors
In this practical you will use an eddy current sensor to measure the thickness of various non-conductive plastic sheets.
Equipment
You will need the following items:
- An eddy current sensor and amplifier circuit (Figure 1),
- Conductive surfaces (steel or aluminium sheets),
- Thin plastic shims (RS Components stock number 681-407),
- Bench power supply, and
- Multimeter.
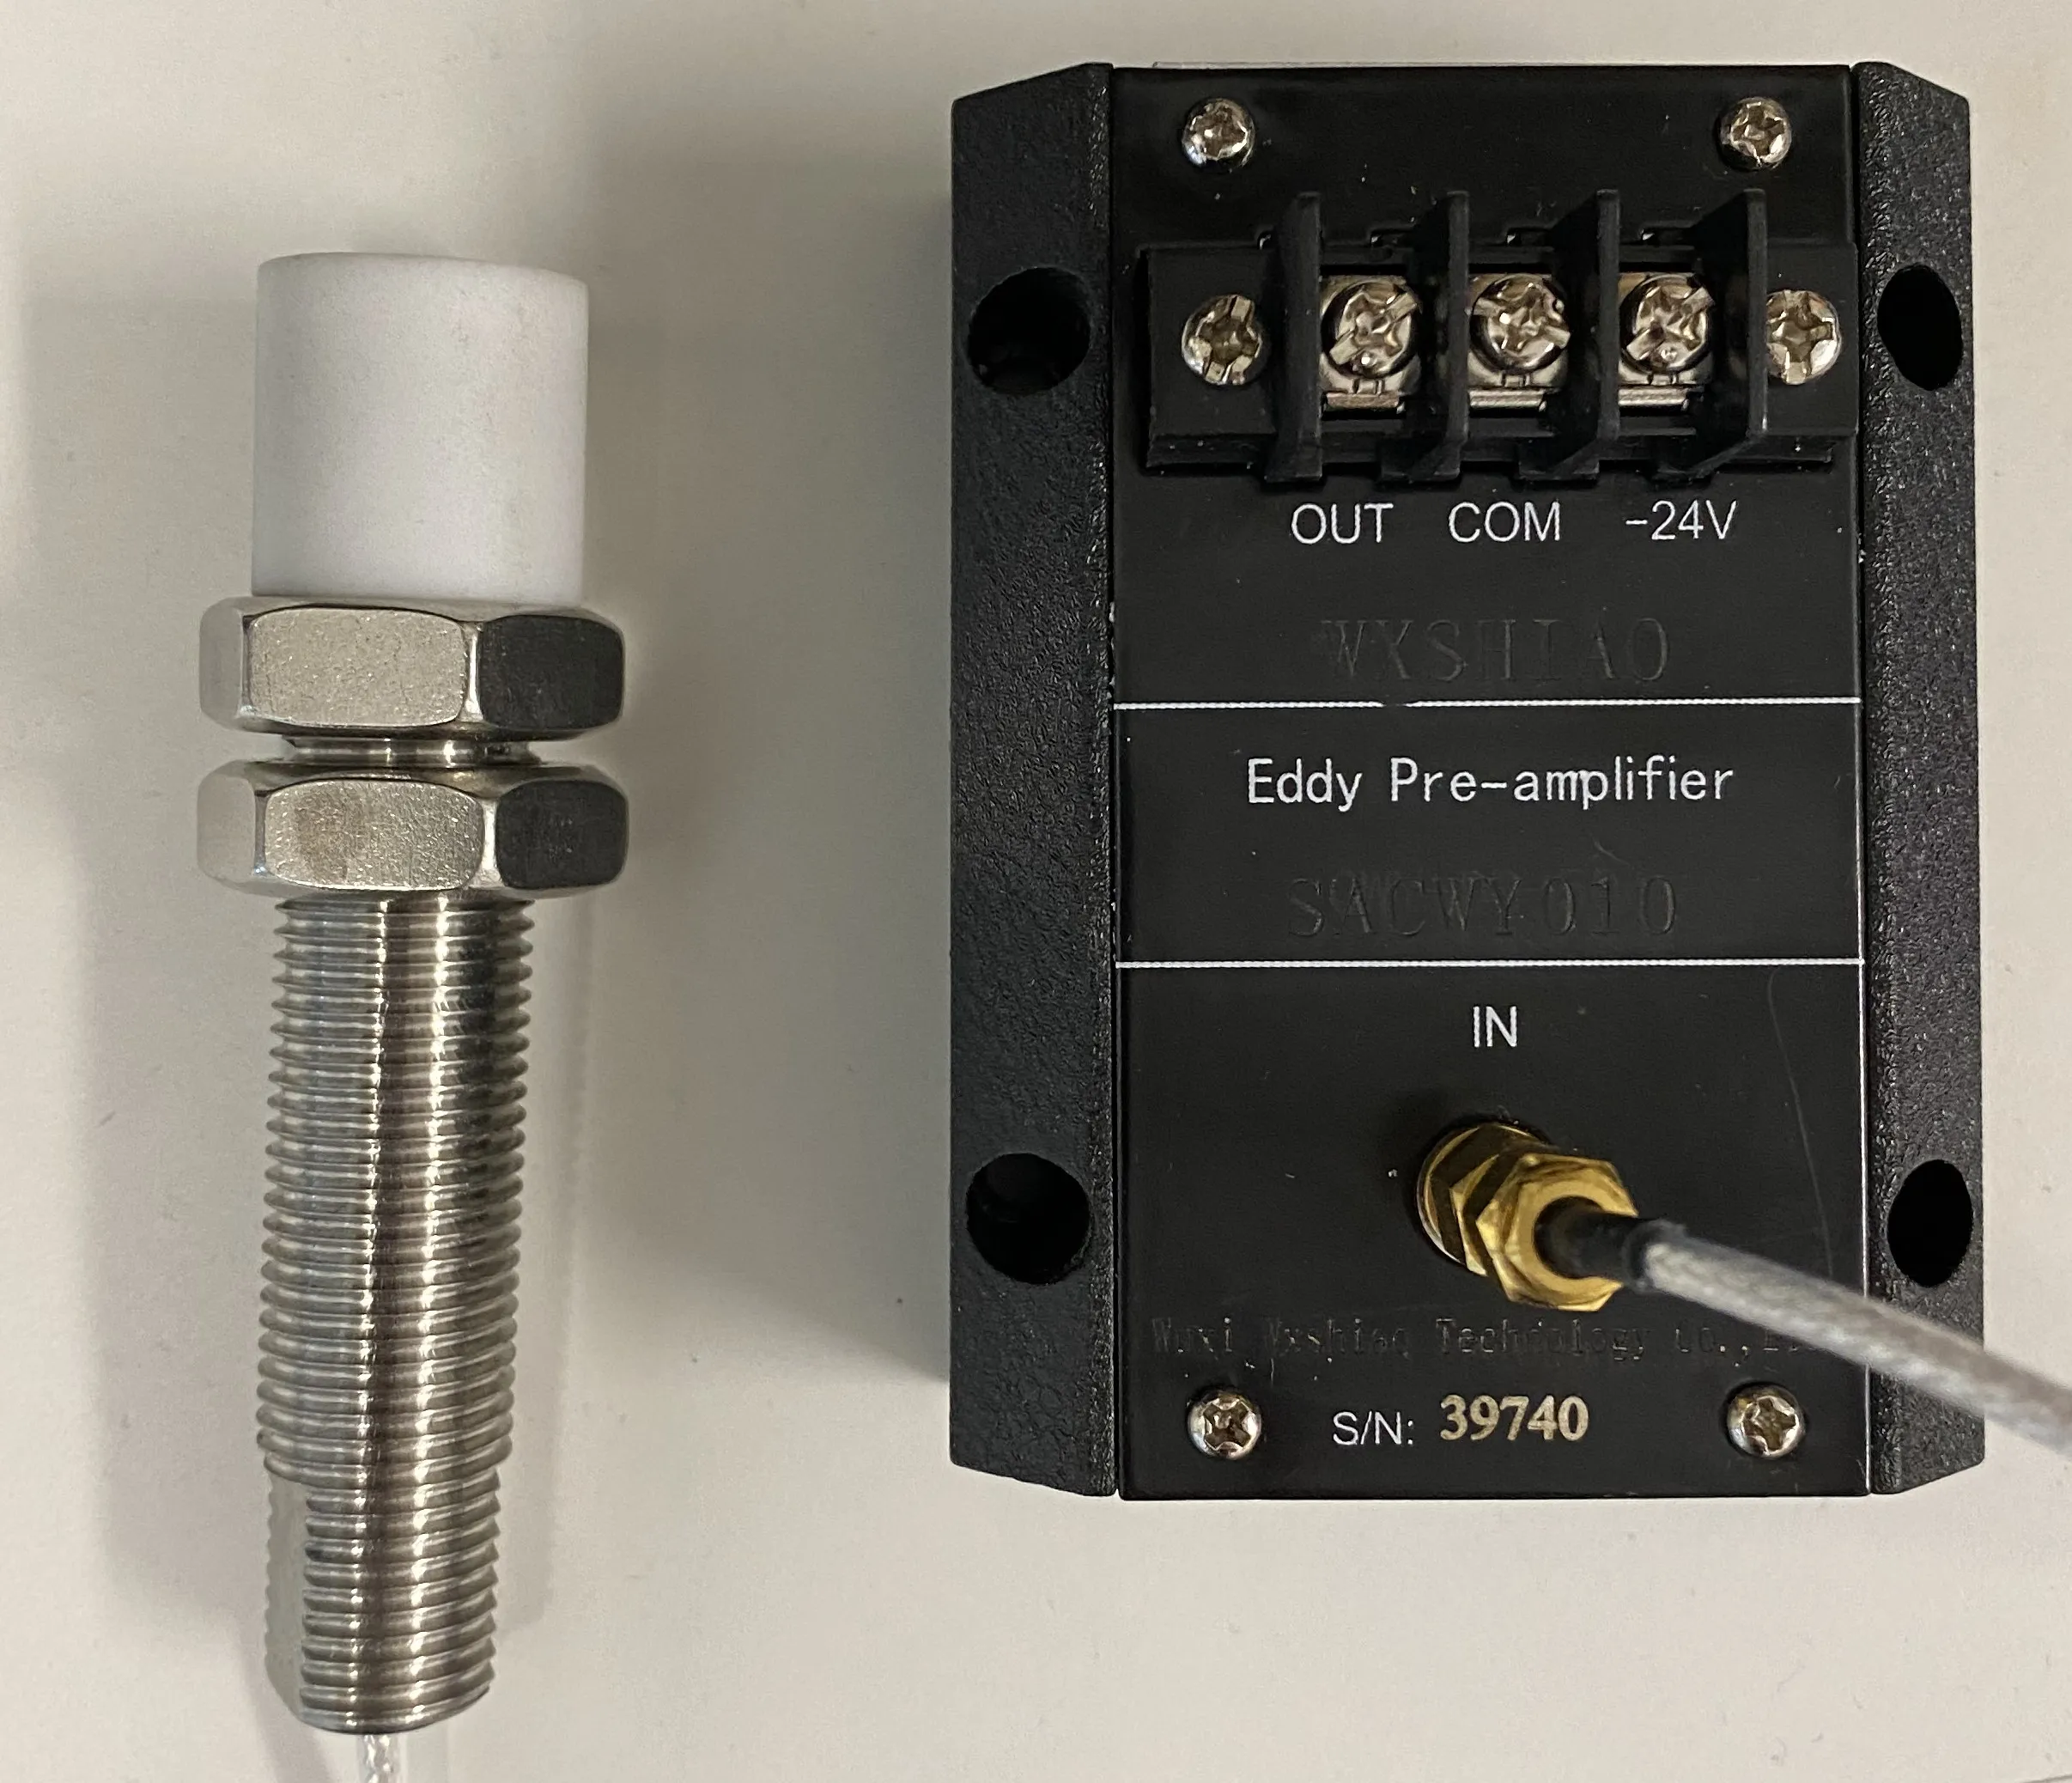
Eddy current sensor with protective cover made of white plastic (left), and amplifier circuit (right).
Zoom:Experimental measurements
- Connect the sensor to the amplifier.
- Set up and connect a DC power supply to the amplifier circuit. The amplifier requires a
| Pin | Meaning | Comments |
|---|---|---|
| OUT | Voltage output | Measure with multimeter. |
| COM | Common (i.e. the zero volt reference for both OUT and -24V) | Connect to the +24 V side of your DC supply, and also to the multimeter ground. |
| -24V | Negative voltage power supply | Connect to the 0 V side of your DC supply. |
- Remove the white plastic cover from the eddy current sensor.
- Choose a type of conductor (steel or aluminium). Monitor the voltage on the amplifier OUT pin when you bring the sensor in proximity to the conductor.
- Place one of the plastic shims between the eddy current sensor and the conductor. Gently press the sensor into the shim so that the distance to the conductor is controlled by the thickness of the shim. Notice that the voltage will vary depending upon the shim’s thickness.
- Complete the table below with your measured voltages:
| Shim colour | Thickness (inches) | Thickness (mm) | Voltage (V) |
|---|---|---|---|
| Blue | 0.002 | 0.05 | |
| Green | 0.003 | 0.08 | |
| Orange | 0.004 | 0.1 | |
| Brown | 0.005 | 0.13 | |
| Transparent white | 0.0075 | 0.19 | |
| White | 0.010 | 0.25 | |
| Red | 0.015 | 0.38 | |
| Yellow | 0.02 | 0.51 |
Note that your voltages will depend upon the type of conductor that you selected.
- When you are finished, reattach the white plastic cover to the sensor, and return the equipment to the box where you found it.
Data analysis
The amplifiers have an excitation frequency of
Plot your measurements (i.e. voltage vs distance from conductor) and comment on the functional form.
Fit a linear function to your measurements to obtain the transfer function for distance measurements. Hint: you can use Excel or Matlab or another software package with curve fitting functionality.
Assessment criteria
You will be awarded a binary mark (1 or 0) based upon completion of the task. To receive a mark of 1, you must:
- Plot the measured transfer function.
- Obtain a trend line that matches the measurements.
If you are not able to complete the task within the scheduled practical session, you have 7 days to complete the above items and submit evidence (photos, etc) by email to your lecturer.