EE3901/EE5901 Sensor Technologies Practical 5 — Accelerometers
In this practical, you will experiment with two types of piezoelectric accelerometers.
Introduction
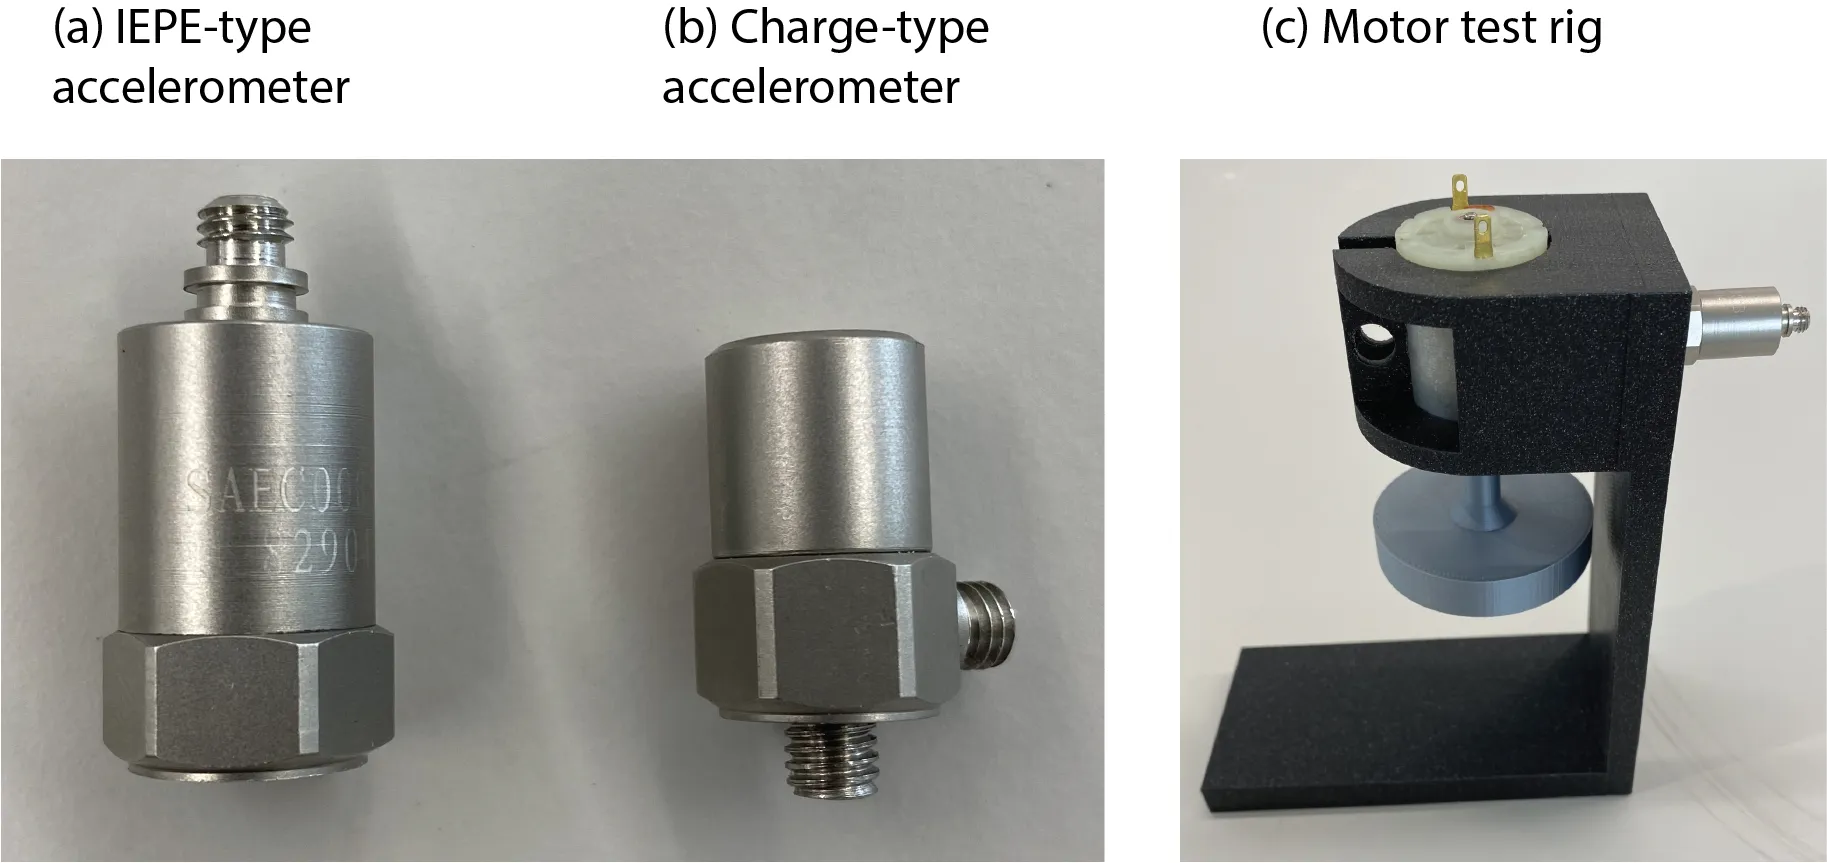
This practical requires you to set up and use two different types of piezoelectric accelerometer (Figure 1). These are:
- A charge-type accelerometer, which is a plain piezoelectric crystal. An external amplifier circuit is required.
- An IEPE accelerometer, which contains a built-in amplifier. An IEPE excitation circuit is required to provide power and read-out the signal.
The equipment for this practical.
Zoom:Equipment
- Motor mounts with 6 - 12 V DC motors (as shown in Figure 1 (c)),
- Charge-type accelerometer (Shiao SAPC0200) and amplifier circuit (SAPE01A),
- IEPE accelerometer (Shiao SAEC005B) and excitation circuit (SAIE01),
- Oscilloscope, and
- Bench power supply.
Your task
Notice that the motor mount includes disks of varying levels of imbalance. By changing the disk, you are able to change the amount of vibration experienced by the accelerometer.
-
Set up the charge-type accelerometer and record the signal on the oscilloscope when the test rig has the most imbalanced disk. The amplifier has the following pinout:
Wire colour Meaning Comments Red +Vcc Need dual power supplies in the range of ±6 V to ± 15 V. The recommended voltage is ± 10V. Yellow -Vcc Black Ground Must be the midpoint of the two power rails. Longer black Cable shield Connect to ground. Blue Signal output Connect to oscilloscope. Observe the level of noise that you see using this setup. Take a photograph or screenshot to enable comparison against the other accelerometer.
-
Repeat the same activity using the IEPE accelerometer. The IEPE signal conditioner is battery powered and has two connectors. The connector labelled “IEPE” runs to the accelerometer. The other connector runs directly to the oscilloscope using shielded coaxial cable.
-
Record the vibration signals for each disk. Does the level of vibration match your expectation regarding which disk is the most or least balanced?
Assessment criteria
You will be awarded a binary mark (1 or 0) based upon completion of the task. To receive a mark of 1, you must
- Show your tutor that you were able to successfully set up and use the two types of accelerometer,
- Demonstrate to your tutor the differences in noise level between the two accelerometers and discuss why this would happen, and
- Show the different vibration levels for each of the disks (e.g. by comparing the peak-to-peak amplitude as measured on the scope).
If you are not able to complete the task within the scheduled practical session, you have 7 days to complete the above items and submit evidence (screenshots, etc) by email to your lecturer.