College of Science and Engineering, James Cook University
Last updated: 21 March 2023
Question 1
A potentiometer is being used as a displacement sensor. It has the transfer function plotted in Figure Q1.
Figure Q1:
The transfer function for use in Question 1.
Zoom:
(a) Over what range of displacements is this sensor linear?
(b) Determine the sensitivity in the linear region.
(c) Write down the transfer function for this sensor (in the linear regime).
(d) You measure Vout using a multimeter that shows two digits after the decimal point, i.e. the multimeter gives readings like 2.21 V and 2.22 V. What is the resolution of this overall system, assuming that you are using the sensor in its linear region?
Answer
(a) The sensor is linear within the range of 0 mm - 2 mm (approximately). The deviation from linearity appears to start just before 2 mm but it is difficult to judge by eye.
(b) The sensitivity is 0.4 V/mm. This is obtained from the slope of the transfer function.
(c) The transfer function is
Vout=0.4x+2,
where Vout is measured in volts and x is the displacement in mm.
(d) The voltage resolution (the smallest change that can be detected) is 0.01 V. We can convert this to mm by using the sensitivity as a conversion factor. By dimensional analysis,
resolution=0.4V/mm0.01V=0.025mm.
Question 2
An accelerometer has a measurement range of ±4g where g is the acceleration due to gravity. The measurement is digitally sampled and represented as a 12-bit signed integer. Assume that the response is linear across the entire measurement range.
(a) What is the sensitivity of this sensor system?
(b) What is the resolution of this sensor system?
(c) By repeatedly sampling the same acceleration, it is found that the measurement noise can be described by a Gaussian distribution whose standard deviation is equal to 4.4 counts in the integer scale of the accelerometer. Convert this to acceleration in units of g.
(d) When the sensor is sitting on the lab bench it is measuring an acceleration of 1 g. Given the noise characteristics of part (c), what is the signal-to-noise ratio?
Answer
(a) The full span is 8g. Meanwhile the full span output covers 212 digital states. In other words the least significant bit (LSB) of the output can change 212 times when sweeping across the entire measurement span. Since we are told that the system is linear, the slope of the transfer function must be:
Sensitivity=8g212LSB=512LSB/g.
(b) For digital systems, the resolution is always the reciprocal of the sensitivity.
Resolution=1.953mg/LSB.
(c) Use the resolution as a conversion factor.
σ=4.4LSB×1.953mg/LSB=8.593mg.
(d) Use the factor of 20 in the signal to noise ratio calculation because we are measuring signal amplitude (not power).
Suppose that an integrated pressure sensor receives dual power supply rails (±5 V). However, the transfer function specified by the manufacturer indicates that the output voltage depends upon the value of the positive supply rail Vp:
Vout=(0.004P−0.04)Vp,(3.1)
where P is the input pressure in kPa and Vp is the positive supply voltage in V. The supply voltage Vp is normally 5.0 V.
The sensor has a measurement range of 0 to 250 kPa.
(a) Find the sensitivity.
(b) Suppose that an inexperienced engineer did not read the entire sensor datasheet and did not find the actual transfer function, Eq. (3.1). Instead, they found a table of performance characteristics that included the sensitivity you calculated in part (a). Based on the sensitivity, they guessed a transfer function of the form
Vout(assumed)=sP,
where s is sensitivity and P is pressure.
The sensor is outputting a voltage of 3.7 V. What is the error in pressure that will result from the use of the incorrect transfer function?
(c) Fortunately the true transfer function (Eq. 3.1) has been found by the design team. However, another problem has arisen.
The prototype device has insufficient voltage regulation, and the supply voltage sometimes drops from the normal 5.0 V down to a minimum of 4.85 V. Unfortunately this variation in the supply voltage is not accounted for. In the transfer function the incorrect value Vp=5.0V continues to be used.
What is the worst case absolute error in the measured pressure caused by this unstable power supply?
Hint: solve the transfer function for the measurement P^(Vout). This will enable you to explore what happens to the apparent pressure P^ when Vout varies. You will need to algebraically rearrange to find an expression for the measurement error P^−P.
Answer
(a) Sensitivity = 0.02 V/kPa.
(b) The hapless engineer uses their incorrect transfer function to obtain the formula
P^=0.02Vout=0.023.7=185kPa.
Meanwhile from the true transfer function we obtain
3.7P=(0.004P−0.04)×5=195kPa
Hence the error is
error=P^−P=10kPa.
(c) Solving the transfer function:
VoutP^=(0.004P^−0.04)×5=50Vout+10.
Next consider the actual Vout when the supply voltage drops:
Vout(actual)=(0.004P−0.04)×4.85=0.0194P−0.194.
Substituting,
P^=50(0.0194P−0.194)+10=0.97P+0.3.
We want to find the error P^−P. For this, we need P on the LHS, so we expand 0.97 into 1 - 0.03 and bring P to the other side:
P^−P=−0.03P+0.3.(3.3)
By sketching this function (Figure A3) or by analysing its functional
form, we can see that the worst case error will occur at the maximum
of the measurement range at P=250 kPa. Therefore the worst case
absolute error is
absolute error=∣−0.03×250+0.3∣=7.2kPa.
Figure A3:
Plot of Eq. (3.3).
Zoom:
Question 4
You are testing an actively powered light sensor that measures light intensity and responds with an electrical current. Your device is rated for a maximum light power of 1000W/m2. You are testing your device by exposing it to different intensities of light from a calibrated source, and you measure the electrical power that is dissipated when the sensor’s output current is passed through a 50 Ω resistor. The resulting measurements are shown in Figure Q4.
Figure Q4:
Measurement results for Question 4.
Zoom:
(a) Estimate the dynamic range of this sensor.
(b) What is the SNR for an input power of 10W/m2?
Answer
(a) DR = 40 dB. You can read this directly from the graph by noticing that there are 4 decades between the noise floor and the maximum output power (since the graph covers the full span of the sensor).
(b) SNR = 20 dB. Note that you need to convert from input power to output power in order to compare against the noise floor. Again you can visually see 2 decades which is 20 dB.
Question 5
Figure Q5:
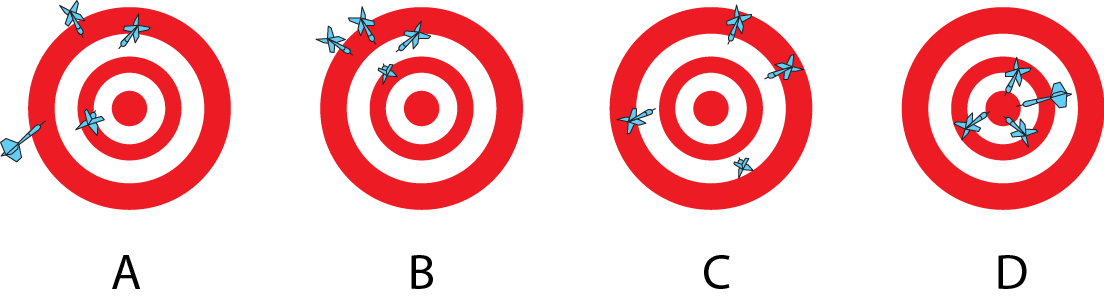
An illustration of “accuracy” (bias) vs precision. Image by Byron Inouye.
Zoom:
A dart board can be used to illustrate the difference between accuracy and precision, where accuracy in this case means bias. Assume that the goal is for all darts to hit the bullseye in the centre of the board.
(a) Rank these boards in order from most accurate to least accurate.
(b) Rank these boards in order from most precise to least precise.
(c) Discussion question: is there a way for you to determine how accurate and precise your own measurements are?
Answer
(a) Cases C and D are the most accurate but it’s difficult to visually determine which is the more accurate of the two. They are approximately equally accurate since the average of all throws is close to the centre. Cases A and B are similar. Hence the ranking from most to least accurate would be: (C and D tied), (A and B tied).
(b) The ranking from most precise to least precise would be: D, B, A, C.
(c) Accuracy (bias) can be determined by measuring reference values that are known through other means. Precision can be determined by measuring the same value repeatedly and studying the noise characteristics.
Question 6
A tachometer is an instrument that measures rotational speed. Suppose that you are working with a tachometer that is mechanically coupled to a shaft and acts as an AC generator by producing a sinusoidal voltage in time with the rotations of the shaft. The tachometer is a 2 pole alternator, i.e. its electrical frequency matches the shaft rotational frequency. The tachometer is an AC voltage source with Zs=10 Ω of output resistance (Figure Q6.1). The tachometer is connected to a servo motor control system with an input resistance of Zm=240 Ω. The servo motor system measures the frequency of the AC voltage at Vo in order to determine the rotational speed of the shaft.
Figure Q6.1:
Circuit diagram showing the tachometer equivalent circuit connected to the motor controller equivalent circuit.
Zoom:
The output voltage of the tachometer is shown in Figure Q6.2.
Figure Q6.2:
Open circuit output voltage for the tachometer.
Zoom:
(a) Notice that the voltage Vo is reduced from the tachometer’s open circuit voltage due to the input impedance of the motor controller. Calculate the relative error in the voltage due to this electrical loading.
(b) In part (a), we treated the tachometer as a resistive device. However in reality its windings are inductive. If Zs included an inductive component, would the error become smaller, stay the same, or increase when the shaft’s rotational speed varies?
(c) Suppose that the windings of the tachometer have an inductance of 50 mH, i.e. Zs is changed to 10 Ω + 50 mH. The servo motor control system requires a minimum RMS voltage of Vo(min) = 1.0 V in order to reliably detect the signal. What is the highest shaft speed that can be measured by this sensor system?
(d) What is the dynamic range of this system?
Answer
(a) Using the voltage divider rule, the output voltage is
Here the ideal value (in the absence of the electrical loading of
Zm) would be simply Vo=Vi. Therefore,
relative error=Vi0.96Vi−Vi=0.96−1=−0.04.
Hence, the relative error is -4%.
(b) The sensor output impedance is Zs=10+jωL, and a faster shaft speed means a larger ω, which means larger ∣Zs∣, hence worse voltage drop. The relative error will become larger (more negative).
(c) The impedance of the tachometer is Zs=10+jωL=10+j0.05ω. Using the voltage divider rule,
Vo=ViZm+ZsZm=Vi250+j0.05ω240.
From Figure Q6.2, the open circuit voltage Vi=1.5 V at high
speeds. Therefore,
Vo=1.5×250+j0.05ω240=250+j0.05ω360.
The question states that we must have ∣Vo∣>1 V. Hence,
we must solve for frequency in the expression
This frequency has units of radians/second. The frequency in hertz is
f≤2π5.1807×103=824.54Hz.
Use dimensional analysis to figure out the conversion ratio from Hz
to rpm. We want units of “per minute” whereas we currently have
“per second”.
fmin=824.54s1×1min60s=49472rpm.
Therefore the maximum shaft speed is 49,472 rpm.
(d) The dynamic range is defined to be
DR=20log10(xminxmax).
The maximum value (from part c) is 49472 rpm. The minimum value can
be determined from Figure Q6.2. Recall that the minimum voltage must
be 1 V. This occurs at 100 rpm. You could simply use 100 rpm directly
from the graph (ignoring the electrical loading of the motor controller),
in which case you could calculate a dynamic range of
DR=20log10(10049472)=53.89dB.
However, a better answer would account for the electrical loading.
You could observe that the low end of Figure Q6.2 has a slope of 1
V per 100 rpm. Therefore you can write
Vi=1001frpm,
where Vi is the open circuit voltage of the tachometer and frpm
is the shaft speed in rpm. At these low speeds, the impedance of the
inductor will be negligible. Therefore, using your result from part
(a),


